Strengths and Weaknesses from Opening Weekend; Power Rankings

Photo Credit: James Bennett/Halifax Thunderbirds
We’re so early in the season that we don’t have a significant sample size of data from this season to really draw any meaningful conclusions from. Right now, it’s flash-in-the-pan performances that more than likely aren’t the norm.
Do you really expect the Rush to give up so many goals off the draw in their remaining 17 games? That the Warriors righties will go 0-fer each week? The FireWolves won’t cash in on so many power play opportunities? The Roughnecks will gift an eight-spot to an opponent they were handily beating for 30 minutes?
I don’t.
So with five more teams about to step on the turf for the first time this regular season, let’s keep things simple. We’ll review interesting strengths and weaknesses of every team that played in one of the five games of NLL 2023-24 Opening Weekend, quickly touch on a Depth Chart update, then wrap this article up with the updated Power Rankings.

Photo Credit: Trevor MacMillan/Halifax Thunderbirds
Rush on Their Heels; Thunderbirds Foot off the Gas
I started tracking goals scored off the first possession post-face-off win, differentiating between those scored in transition and those scored off a settled set. The vague thought process was we could learn how lax defenses were after losing a face-off, especially if those goals came immediately off the draw. I imagined we’d see one, maybe two per game throughout the season.
The Thunderbirds had 11 goals off the draw. Four of them were in transition. The Rush didn’t do enough to stop Jake Withers storming towards the crease after a face-off win. When they finally did, Dawson Theede was there to cash in on those terrified slides towards the Wizard of Draws (print the shirts, Thunderbirds).
Eleven is exorbitant, but the rest of the NLL didn’t exactly do any favors towards my “face-offs don’t matter that much” argument last weekend.
Looking towards the TBirds, I’d be remiss for not mentioning half their goals against came in the fourth quarter. It’s a clear indicator of taking the foot of the gas late with a comfortable lead, something hard to admonish them for given their performance. That said, three of the four SHFBG against came in that final frame. One of them was Ryan Barnable’s falling one-handed backhander, which I can’t see being dethroned as Goal of the Year.
Regardless of how insanely good one of those goals was, it doesn’t change the fact the Thunderbirds let the Rush run their way back into Saturday’s game. One of the Rush’s six goals came from the even strength side of things, and the Rush only had four such legitimate scoring chances in the final 15 minutes of action.

Photo Credit: Mike Kirschbaum/Las Vegas Desert Dogs
Settle Down, Desert Dogs; Go for the Throat, FireWolves
As of this writing, James Barclay’s pair of cross checks, spear, and multiple punches against Leo Stouros weren’t upgraded to anything more severe than <checks notes> a spearing minor penalty, but it is indicative of the penalty-heavy game the Desert Dogs played last Saturday.
Those man-down opportunities skewed set differentials between the FireWolves and Desert Dogs. The FireWolves had 20 PPSets compared to the Desert Dogs’ pair. Conversely, the Desert Dogs enjoyed (not the right word) 12 shorthanded sets. Unlike their opponent, they actually cashed in on special teams, albeit without the advantage of a penalty within their favor. Fun note about that veteran shorthanded goal scored by Rob Hellyer — it was one of two shorties scored last weekend that didn’t come in transition. The other one was Blaze Riorden’s hat trick for the Wings.
It’s a fun game of what could have been for the FireWolves. They trailed for most of Saturday’s contest, but when the final buzzer sounded, they had a 9-6 lead in the even strength category. All six goals in the fourth quarter were scored 5-on-5, but the FireWolves potted double the Desert Dogs’ amount.
He who wins the settled game controls the world.
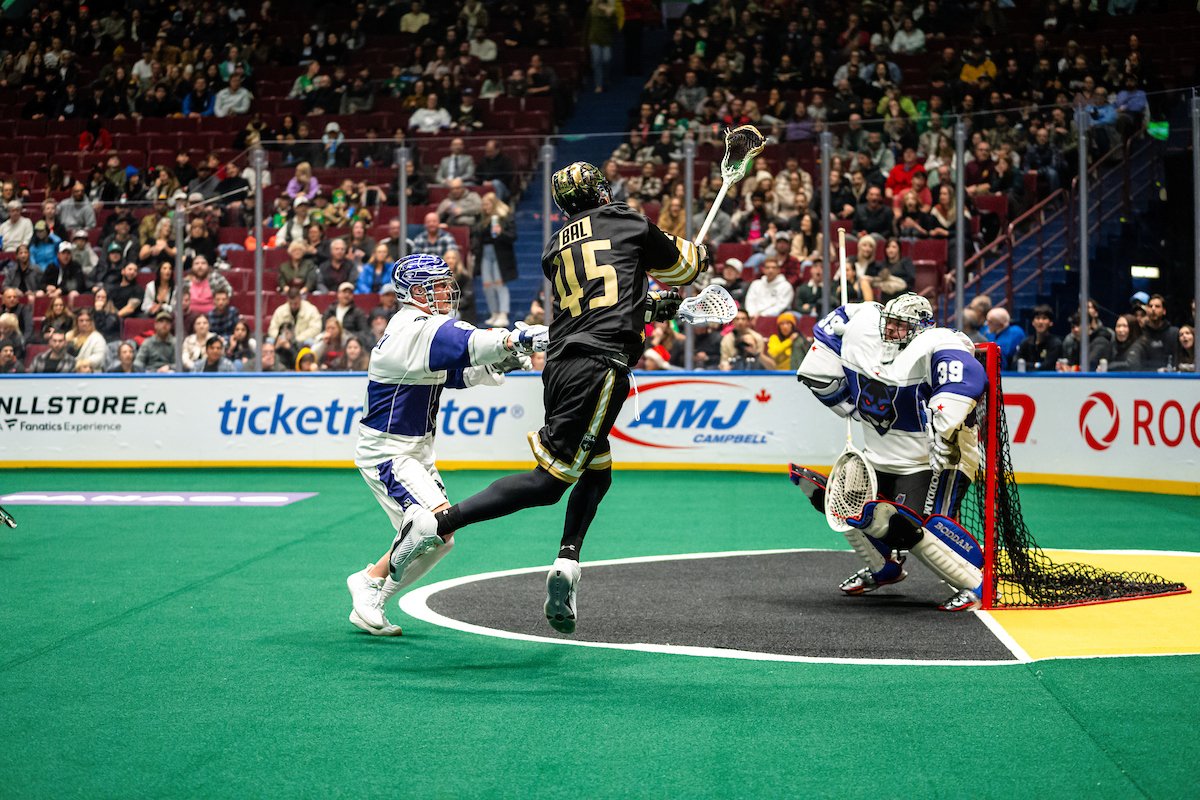
Photo Credit: Jordan Leigh Creative/Vancouver Warriors
Works 60% of the Time, Everytime
I know I’ve made that joke somewhere before about PCLC; I just don’t remember exactly where.
I mentioned it in my article reviewing a full season of NLL team stats that Panther City’s even strength game was the worst of all the postseason teams last season, posting a -19 goal differential. Only the FireWolves, Desert Dogs, and Riptide had a worse differential in this set type.
But Panther City succeeded because they handled their business on special teams and in transition. And after Friday’s win against the Warriors, it looks like that gameplan will continue this season.
The Lacrosse Club and Warriors were actually in sync even strength. Both squads netted a trio of ESG and had an ESE% of 5.8% on 52 sets, with 26 shots on goal. It’s almost spooky how identical those numbers are.
Yet the Warriors didn’t cash in on special teams, scoring one PPG despite having 8 PPSets. PCLC netted two on 6 PPSets. They also outran the home squad, scoring a trio of FBG compared to the Warriors’ pair. That seems close until you look at the sets again. The Warriors had 7 FBSets, but Panther City pounced with 17 FBSets. Gifting a wealth of transition opportunities isn’t really a recipe for success (Warriors), but cashing in on those chances certainly is (Panther City).
Maintaining a close settled game and getting more production in other areas won PCLC a game they were down early in. It worked last season; might as well do it again.
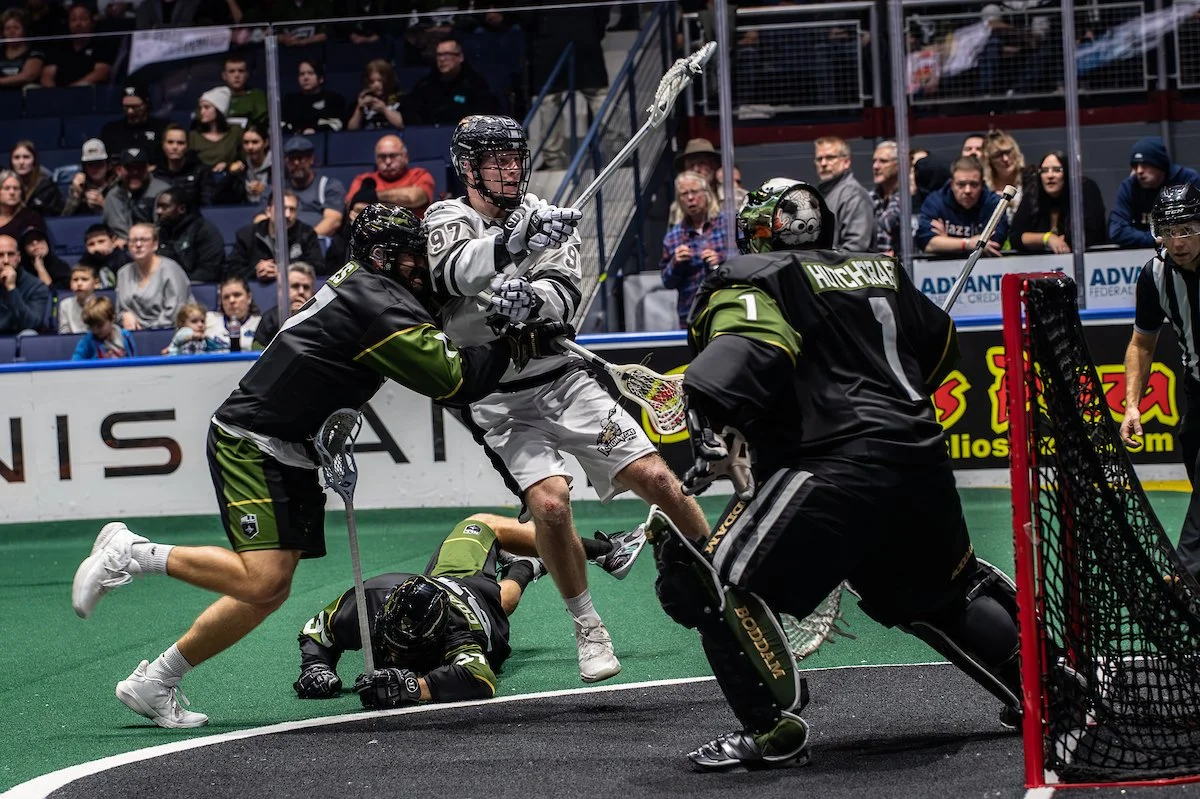
Photo Credit: Rochester Knighthawks
Do What No One Else Will
4-on-4 baybee!
I shouldn’t be this excited over such a stupid number, but I honestly expected more after five games. The NLL updated the rules regarding coincidental minor penalties ahead of this season. No longer will the offending parties have to sit in the box while 5-on-5 play ensues. Now it’s 4-on-4 until the two minutes are up.
You’d think more goals would be scored with more room on the turf, but nope. Only the Knighthawks could answer the 4-on-4 clarion, cashing in on their lone diminished settled set.
Do better 4-on-4, everyone else.
Especially Calgary, but this is more about doing better on all settled sets in general. 5-on-5, they had 16 sets without a shot recorded, leading to a 30.2 ESLP%. Three teams had worse numbers for that stat, but none of those three teams made the playoffs last season.
While the number of lost possessions wasn’t actually worse in the second half, their settled SOG% took a hit. In the first half, Calgary took 24 shots, 18 of which were on goal, and had 12 settled sets end without a shot attempt. Second half, the lost possessions got cleaned up, as they only wasted four. However, their SOG% went from 75.0% to 54.1%, as just 13 of their 24 ES shots made it on cage in the final 30 minutes.
Credit where it’s due: Rochester’s defense stepped up in the second half and outphysicaled the Roughneck’s O.

Photo Credit: Brandon Hill/New York Riptide
Don’t Dunk on this ’Tide D
Hi, dead horse, it’s me, returning to harp on the 2023 Riptide defense being bad again. I don’t <thud> really like belaboring <thud> this point <thud>, but it’s important to review <thud> so we can appreciate <thud> the Riptide this season <thud>.
Last season, the Riptide defense stunk, with only the Warriors defense statistically being worse. It was a goalie carousel until Cam Dunkerley settled things down, but his GSAA still took a hit because of the defense in front of him.
Even strength, the defense posted a 13.0 ESE%, the worst metric in this category and 1.6% more than league average. That might not sound too bad considering it’s 1.6%, but over the Riptide’s 1,062 sets, that’s an extra 17 goals throughout the season, almost an extra goal against per game.
Now reinforced, the Riptide took on a really good Wings team last Saturday, and even with the loss, there are positives from the defense’s end that suggest GM Rich Lisk’s offseason roster moves are bearing fruit. The Riptide held the Wings to a 9.3 ESE%, the fifth lowest percentage from Opening Weekend. Their FBE% against was 20.0%, impressive considering 15 of the Wings’ 83 sets were in transition. The penalty kill could’ve been better, but again, see “really good Wings team.”
It’s early, but I’m a fan of what the Riptide showed last Saturday night on the defensive side of things. If the offense starts cashing in more consistently, that will take some of the pressure off Dunkerley and Co. But Zach Higgins has a habit of ruining an opponent’s night with his stellar play between the pipes, so maybe the O shouldn’t beat themselves up too much.
Oh, I need a stat for Philly. Higgins is stupid good and underappreciated, a drum I’ll happily whale on all season long. His 5.16 GSAA leads all 12 netminders that have played this season.
Look at the Big Brain on Brad
My depth charts have existed since my Swarm days, and I never really put much thought into how I laid them out, particularly the defenders. The thought process pre-pandemic was base the hands off the goalies — righties on the righthand side of the goalie, lefties on the lefthand side.
Which is kinda sorta super dumb considering that’s not where lefty and righty defenders play on the floor, and it’s one of those things that’s obvious as hell after someone points it out to you, and you feel like an idiot Wednesday night nearly four years later for not having had that original thought.
So, muchas gracias to Brad of “look-at-his-big-brain” fame for DM-ing me the suggestion that made way too much sense to not implement. If you visit the Depth Charts now, hopefully you notice right-handed defenders facing left-handed forwards and vice versa.

Photo Credit: Brandon Hill/New York Riptide
Power Rankings
Friendly reminder:
An NLL season is a marathon, not a race. Placement is based on what teams show over a period of time. Just because a team completely revamped their roster in the offseason or beat a team that was above them in the rankings one week doesn’t mean they automatically jump up spots.
Records are not what I base rankings on. If a team wins 14 games to start the season and then drops the next four badly, then that recent performance will weigh more than them having the best record that season.
This is supposed to be fun. I take this mildly seriously, but it’s just, like, my opinion, man. It’s not worth getting worked up over.
I’m not really going to break down why teams shifted. Most of that was done above breaking down each team that played last weekend. Sorry in advance to Colorado, who dropped precipitously without playing — I didn’t know what to do with you.
Power Rankings are dumb, let’s overreact:
15. Las Vegas Desert Dogs (0-1)
Previous ranking: 14
Week 1 results: 12-10 loss to the FireWolves
14. Albany FireWolves (1-0)
Previous ranking: 15
Week 1 results: 12-10 win against the Desert Dogs
13. Vancouver Warriors (0-1)
Previous ranking: 13
Week 1 results: 11-7 loss to Panther City
12. Saskatchewan Rush (0-1)
Previous ranking: 11
Week 1 results: 17-12 loss to the Thunderbirds
11. New York Riptide (0-1)
Previous ranking: 12
Week 1 results: 13-10 loss to the Wings
10. Georgia Swarm (0-0)
Previous ranking: 10
Week 1 results: Did not play
9. Colorado Mammoth (0-0)
Previous ranking: 5
Week 1 results: Did not play
8. Calgary Roughnecks (0-1)
Previous ranking: 4
Week 1 results: 14-13 loss to the Knighthawks
7. Philadelphia Wings (1-0)
Previous ranking: 8
Week 1 results: 13-10 win against the Riptide
6. Panther City (1-0)
Previous ranking: 6
Week 1 results: 11-7 win against the Warriors
5. Rochester Knighthawks (1-0)
Previous ranking: 9
Week 1 results: 14-13 win against the Roughnecks
4. Halifax Thunderbirds (1-0)
Previous ranking: 7
Week 1 results: 17-12 win against the Rush
3. San Diego Seals (0-0)
Previous ranking: 3
Week 1 results: Did not play
2. Buffalo Bandits (0-0)
Previous ranking: 2
Week 1 results: Did not play
1. Toronto Rock (0-0)
Previous ranking: 1
Week 1 results: Did not play