Don’t Sleep on the Desert Dogs Defense
Las Vegas’s back end is quietly putting together a strong, if inconsistent, second season for the franchise
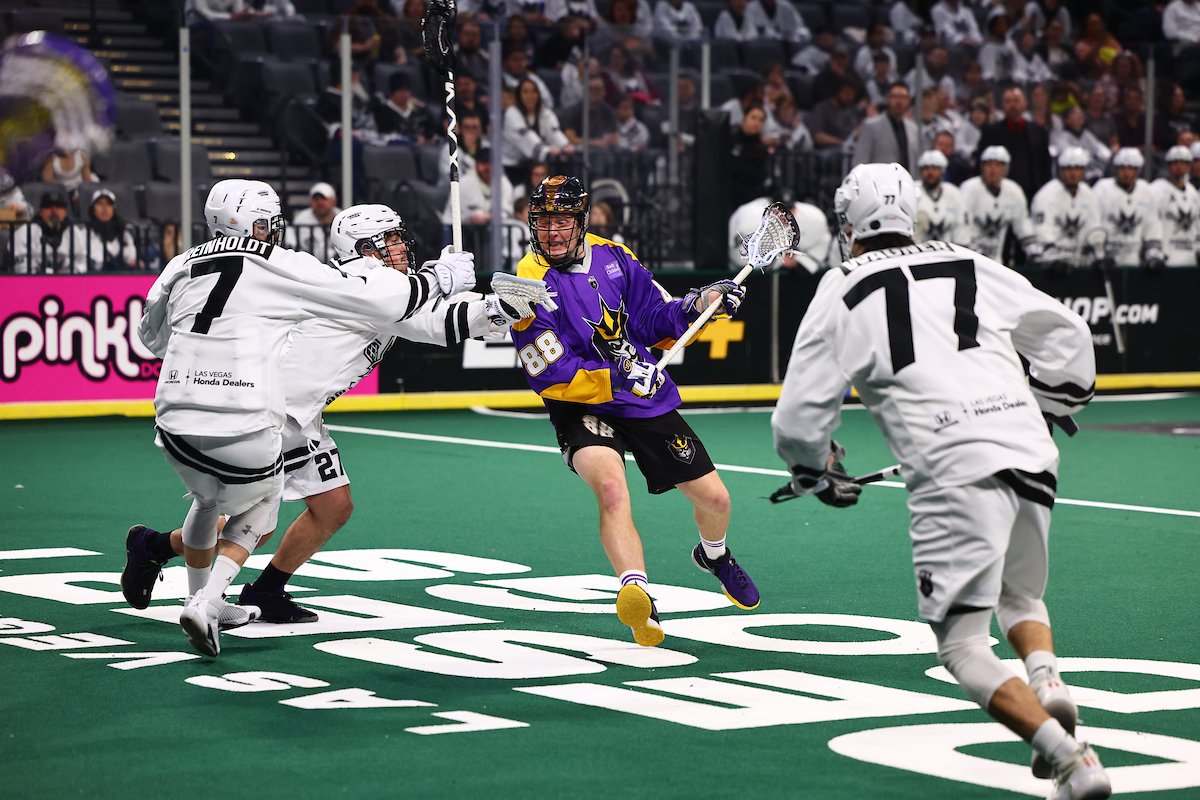
Photo Credit: Mike Kirschbaum/Las Vegas Desert Dogs
A National Lacrosse League season is typically one of peaks and valleys. Teams hope to string together plenty of peaks, turning them into plateaus with few dips in there. In 2023-24, there are a few teams that are achieving that goal, but most are on a rollercoaster.
The Las Vegas Desert Dogs are no exception both in desired results and reality, a model in inconsistency. They’re 3-6 midway through their sophomore season, albeit with big wins against teams that were over .500 at the time of their respective matchups. The one thing that has been mostly consistent is the fact we’re not paying enough attention to how their defense has been pretty damn good over the past five games; we just let one loss to Panther City overshadow those other four games. In the other four games, Vegas is averaging 9.0 GA/GAME
That 21-spot PCLC put up on Vegas back on Jan. 27 was more than a black eye — it was a pair of shiners, a broken nose, and a tooth knocked out. The only reason they kept their wallet during that mugging was because Callum Crawford got benched late in the third quarter.
We can even go a bit further back and look at the pair of losses to the Saskatchewan Rush and Calgary Roughnecks in December, where the Desert Dogs gave up 34 total goals. That’s three combined games with 55 goals against, 18.3 GA/GAME, a collective .656 Sv% between goalies Landon Kells and Joel Watson.
Picking and choosing data to support arguments is Sportswriting Stats 101. I don’t think we can completely ignore those three performances when we look at Vegas’s season as a whole, but I think we’re missing the forest for the trees if we don’t cherrypick the other way and look at the Desert Dogs defense in those six other games.
(Power rankings at the end.)

Photo Credit: Mike Kirschbaum/Las Vegas Desert DogsColleen Shaw/Panther City LC
Let’s start with the Desert Dogs defense’s cumulative totals. They’ve allowed 113 goals against for a 12.56 GA/GAME, tied with the Bandits for fifth highest in the NLL (that’s not a typo; the defending champs have a bottom five defense). Las Vegas has given up 75 even strength goals (most in the NLL — all numbers are True, meaning there will be some overlap), 20 power play goals (fourth most), 12 transition goals against (lowest in the league), and a pair of shorthanded goals (third least).
Those last two are pretty impressive. Teams don’t see success against the Desert Dogs in transition or when they’re man-down. But considering how bad their even strength game is — their -31 goal differential in TrueES is the worst in the league, just ahead of the Mammoth at -26 —, teams don’t really have to force the issue in those areas.
Slash lines (S%/SOG%/E%) against for all of their True stats:
TrueES
17.8/70.1/15.9
TruePK
17.3/69.3/16.4
TrueFB
13.8/77.0/12.8
TrueSH
6.7/50.0/4.7
Vegas’s defense doesn’t spend more time 5-on-5 than anyone else. In fact, they’re just barely below league average at 63.3% (NLL average is 63.5). They do spend more time on the penalty kill, 13.4% of their total defensive shifts (12.3% for NLL mean). Teams run less against them, 13.1% (14.1% NLL mean).
At the end of the day, the Desert Dogs are getting killed 5-on-5 on roughly a league-average amount of settled defensive shifts. Their penalty kill numbers aren’t much better. Those two being an area of weakness for the Desert Dogs means they look stronger at preventing transition and shorthanded markers, although again, getting dominated in those first two facets means teams don’t feel the pressure to succeed in those latter areas.

Photo Credit: Mike Kirschbaum/Las Vegas Desert Dogs
So, we have the baseline out there. Let’s start using selective math, starting off with this: Those two areas where Las Vegas’s defense struggles — TrueES and TruePK — are really skewed thanks to those three losses we’ll be removing from the equation. In losses to the Rush, Roughnecks, and PCLC, the Desert Dogs have goal differentials of -23 ES and -6 PP.
In their six non-blowout games, the Desert Dogs defense has the following True slash lines:
TrueES
13.4/69.3/10.3
TruePK
14.3/68.3/14.5
TrueFB
12.7/77.8/11.3
TrueSH
0.0/55.0/0.0
The current league-average slash line for TrueES and TruePK are 13.7/68.4/12.1 and 18.0/71.0/18.7, respectively. If Vegas had those as their actual defensive slash lines for the season, they’d be tied for the third-best ES defense in the NLL and the second-best penalty kill unit.
Defensive ESSets percentages go up to 70.4%, PKSets a bit of a bump to 13.9%, and FBSets also experience a significant jump to 16.0%. Subtracting their goals for in those three contests, the Desert Dogs would have a +0 goal differential — -8 TrueES, +0 TruePP, +4 TrueFB, +5 TrueSH.
What’s it all mean?
When they’re playing the game defensive coordinator Phil Wetherup wants them playing, the Desert Dogs defense can be elite. It’s scrappy settled, clogging lanes with bodies and sticks. They’re still losing the settled game, but I’m more willing to blame an offense averaging 4.83 ESG/GAME (which is barely less than their cumulative season total of 4.89) for not doing their part.
The Desert Dogs’ top four defenders have been very solid. Connor Kirst (who should get more love considering how incredible his game is in just under three seasons and having zero box games played before dressing for the Swarm as a rookie) has the second-most caused turnovers in the NLL. James Barclay and Tor Reinholdt are seventh and tied for eighth, respectively, in blocked shots. Kirst and Reinholdt are in the top 25 in the NLL in loose balls. John Wagner’s quietly putting together another strong defensive season.
I’d be remiss if I didn’t talk about starting netminder Landon Kells. The 23-year-old faces 52.32 SOG/60 (NLL mean is 51.71) and has a 12.21 GAA, .767 Sv%, and -5.25 GSAA across 516:04 min. in 2023-24. But if we again remove that trio of blowouts, his numbers improve dramatically. Kells has a 9.59 GAA, .814 Sv%, and 10.20 GSAA in 362:55 min. in those six games. If he had that GSAA today, he’d be behind only Nick Rose (17.52) in that category, an instant contender for Goaltender of the Year.
Defense wins championships. When the Desert Dogs defense is on their game, they’re better than good — they’re elite. It’s exactly what GM and head coach Shawn Williams wants from that end of the floor, but it’s currently missing consistency. Factor in an offense that’s the worst in the NLL, and it’s resulted in a 3-6 record in year two of the franchise.
All the Desert Dogs defenders can do is make Kells’ job easier. If they figure out the consistency bit, then the other 14 NLL teams will be afraid to go to the desert.

Photo Credit: WM Photography/Albany Firewolves
Power Rankings — Week 12
Friendly reminder:
An NLL season is a marathon, not a race. Placement is based on what teams show over a period of time. Just because a team completely revamped their roster in the offseason or beat a team that was above them in the rankings one week doesn’t mean they automatically jump up spots.
Records are not what I base rankings on. If a team wins 14 games to start the season and then drops the next four badly, then that recent performance will weigh more than them having the best record that season.
This is supposed to be fun. I take this mildly seriously, but it’s just, like, my opinion, man. It’s not worth getting worked up over.
15. Vancouver Warriors (2-7)
Previous ranking: 15
Week 12 results: Did not play
14. Colorado Mammoth (3-7)
Previous ranking: 13
Week 12 results: 13-11 loss to the FireWolves
13. Philadelphia Wings (3-5)
Previous ranking: 14
Week 12 results: 10-8 win against the Desert Dogs
12. Rochester Knighthawks (3-5)
Previous ranking: 12
Week 12 results: Did not play
11. Saskatchewan Rush (3-4)
Previous ranking: 11
Week 12 results: Did not play
10. Las Vegas Desert Dogs (3-6)
Previous ranking: 10
Week 10 results: 10-8 loss to the Wings
9. Panther City LC (4-4)
Previous ranking: 9
Week 12 results: Did not play
8. Calgary Roughneckss (4-5)
Previous ranking: 8
Week 12 results: 17-11 win against the Thunderbirds
7. New York Riptide (5-5)
Previous ranking: 7
Week 12 results: 16-10 loss to the Rock
6. Buffalo Bandits (5-4)
Previous ranking: 5
Week 12 results: 14-12 loss to the Thunderbirds
5. Halifax Thunderbirds (6-4)
Previous ranking: 5
Week 12 results: 14-12 win against the Bandits; 17-11 loss to the Roughnecks
4. Georgia Swarm (6-4)
Previous ranking: 4
Week 12 results: Did not play
3. Albany FireWolves (7-2)
Previous ranking: 3
Week 12 results: 13-11 win against the Mammoth
2. San Diego Seals (6-3)
Previous ranking: 2
Week 12 results: Did not play
1. Toronto Rock (7-2)
Previous ranking: 1
Week 12 results: 16-10 win against the Riptide